Goodness of fit of the selected non-extreme marginal distribution
Diag_Non_Con_Trunc_Sel.RdPlots demonstrating the goodness of fit of a selected (truncated) non-extreme marginal distribution to a dataset.
Usage
Diag_Non_Con_Trunc_Sel(
  Data,
  Selected,
  Omit = NA,
  x_lab = "Data",
  y_lim_min = 0,
  y_lim_max = 1
)
Arguments
- Data
Numeric vector containing realizations of the variable of interest.
- Selected
Character vector of length one specifying the chosen distribution, options are the Birnbaum-Saunders
"BS", exponential"Exp", two-parameter gamma"Gam(2)", three-parameter gamma"Gam(3)", mixed two-parameter gamma"GamMix(2)", mixed three-parameter gamma"GamMix(3)", lognormal"LNorm", Tweedie"Twe"and Weibull"Weib".- Omit
Character vector specifying any distributions that are not to be tested. Default
"NA", all distributions are fit.- x_lab
Character vector of length one specifying the label on the x-axis of histogram and cummulative distribution plot.
- y_lim_min
Numeric vector of length one specifying the lower y-axis limit of the histogram. Default is
0.- y_lim_max
Numeric vector of length one specifying the upper y-axis limit of the histogram. Default is
1.
Value
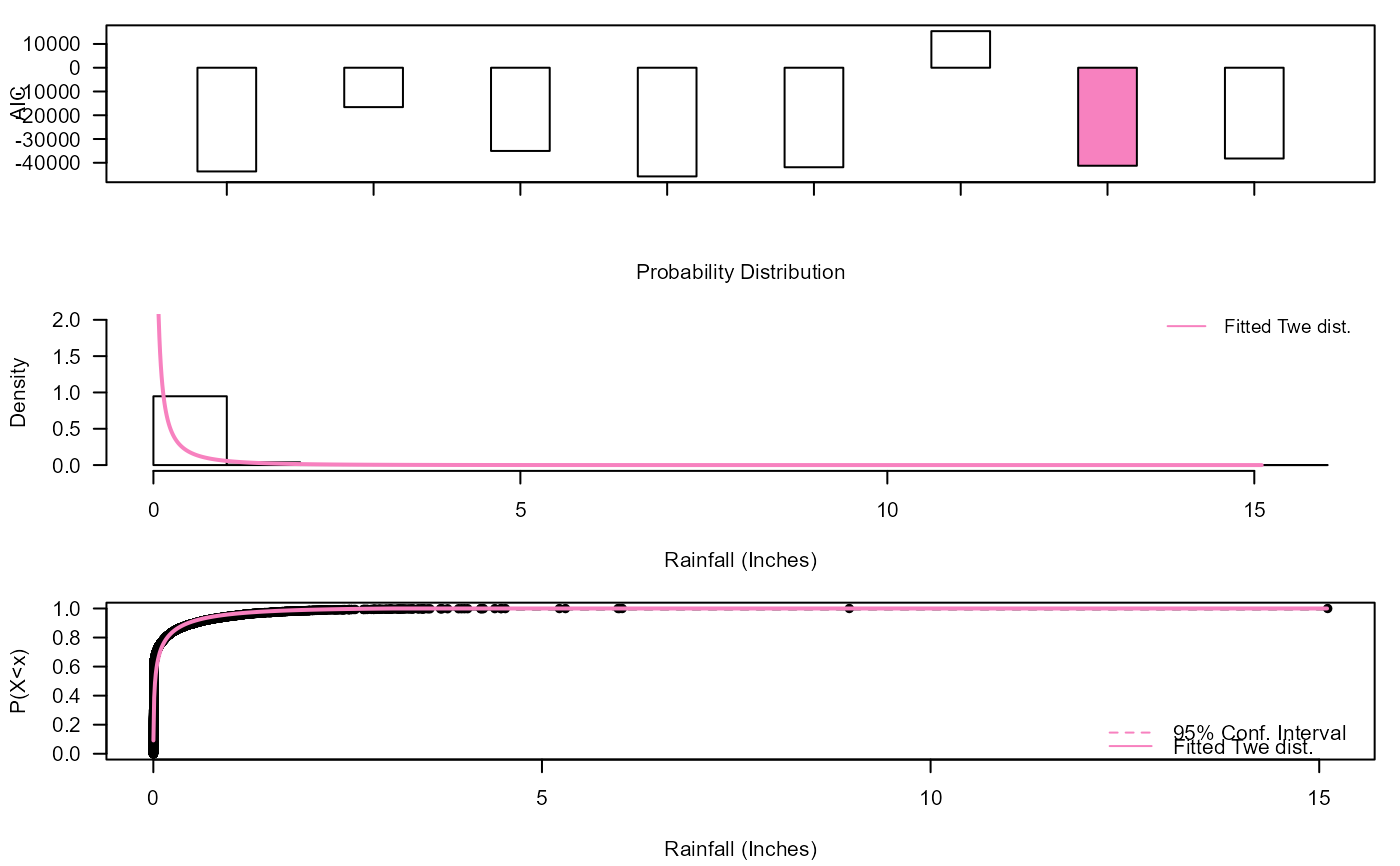
Panel consisting of three plots. Upper plot: Plot depicting the AIC of the eight fitted distributions. Middle plot: Probability Density Functions (PDFs) of the fitted distributions superimposed on a histogram of the data. Lower plot: Cumulative Distribution Functions (CDFs) of the fitted distributions overlaid on a plot of the empirical CDF.
Examples
S20.OsWL<-Con_Sampling_2D(Data_Detrend=S20.Detrend.df[,-c(1,4)],
Data_Declust=S20.Detrend.Declustered.df[,-c(1,4)],
Con_Variable="OsWL",Thres=0.97)
S20.OsWL$Data$Rainfall <- S20.OsWL$Data$Rainfall + runif(length(S20.OsWL$Data$Rainfall),0.001,0.01)
Diag_Non_Con_Trunc(Data=S20.OsWL$Data$Rainfall,x_lab="Rainfall (Inches)",
y_lim_min=0,y_lim_max=2)
#> Warning: NaNs produced
#> Warning: NaNs produced
#> Warning: Algorithm RS has not yet converged
#> Warning: non-list contrasts argument ignored
#> Warning: glm.fit: algorithm did not converge
#> Warning: glm.fit: algorithm did not converge
#> Warning: glm.fit: algorithm did not converge
#> Warning: NaNs produced
#> Warning: NaNs produced
#> Warning: NaNs produced
#> Warning: NaNs produced
#> Warning: NaNs produced
#> Warning: NaNs produced
#> Warning: NaNs produced
#> Warning: NaNs produced
#> Warning: NaNs produced
#> Warning: NaNs produced
#> Warning: NaNs produced
#> Warning: NaNs produced
#> Warning: NaNs produced
#> Warning: NaNs produced
#> Warning: NaNs produced
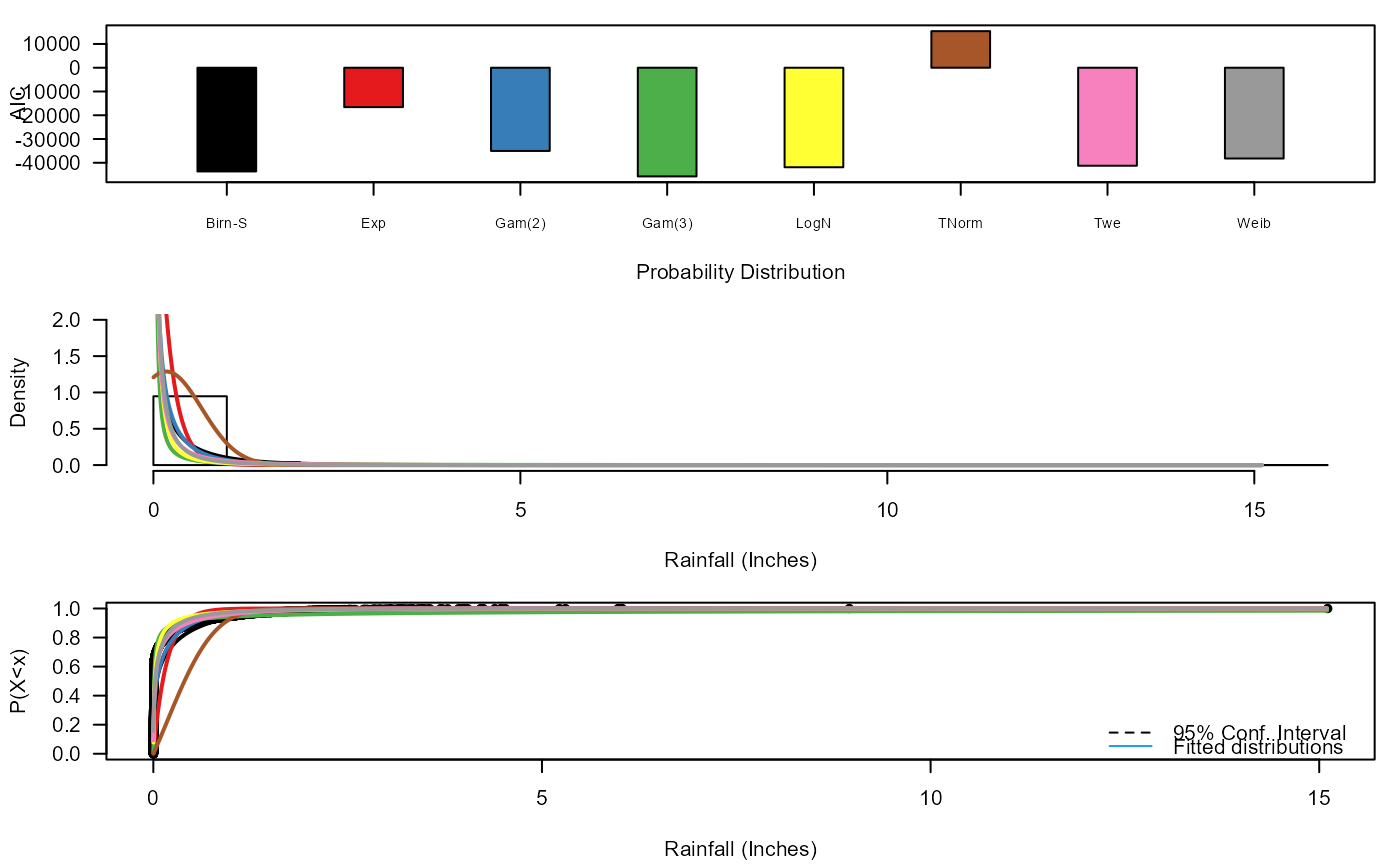 #> $AIC
#> Distribution AIC
#> 1 BS -43649.82
#> 2 Exp -16578.55
#> 3 Gam(2) -35022.42
#> 4 Gam(3) -45740.94
#> 5 LNorm -41884.67
#> 6 TNorm 15391.98
#> 7 Twe -41248.86
#> 8 Weib -38203.80
#>
#> $Best_fit
#> [1] "Gam(3)"
#>
Diag_Non_Con_Trunc_Sel(Data=S20.OsWL$Data$Rainfall,x_lab="Rainfall (Inches)",
y_lim_min=0,y_lim_max=2,Selected="Twe")
#> Warning: NaNs produced
#> Warning: NaNs produced
#> Warning: Algorithm RS has not yet converged
#> Warning: non-list contrasts argument ignored
#> Warning: glm.fit: algorithm did not converge
#> Warning: glm.fit: algorithm did not converge
#> Warning: glm.fit: algorithm did not converge
#> Warning: NaNs produced
#> Warning: NaNs produced
#> Warning: NaNs produced
#> Warning: NaNs produced
#> Warning: NaNs produced
#> Warning: NaNs produced
#> Warning: NaNs produced
#> Warning: NaNs produced
#> Warning: NaNs produced
#> Warning: NaNs produced
#> Warning: NaNs produced
#> Warning: NaNs produced
#> Warning: NaNs produced
#> Warning: NaNs produced
#> Warning: NaNs produced
#> Warning: non-list contrasts argument ignored
#> 1.5 1.7 1.9 2.1 2.3 2.5
#> .....
#> Warning: glm.fit: algorithm did not converge
#> .
#> Warning: glm.fit: algorithm did not converge
#> Done.
#> Warning: glm.fit: algorithm did not converge
#> Warning: non-list contrasts argument ignored
#> 1.5 1.7 1.9 2.1 2.3 2.5
#> .....
#> Warning: glm.fit: algorithm did not converge
#> .
#> Warning: glm.fit: algorithm did not converge
#> Done.
#> Warning: glm.fit: algorithm did not converge
#> $AIC
#> Distribution AIC
#> 1 BS -43649.82
#> 2 Exp -16578.55
#> 3 Gam(2) -35022.42
#> 4 Gam(3) -45740.94
#> 5 LNorm -41884.67
#> 6 TNorm 15391.98
#> 7 Twe -41248.86
#> 8 Weib -38203.80
#>
#> $Best_fit
#> [1] "Gam(3)"
#>
Diag_Non_Con_Trunc_Sel(Data=S20.OsWL$Data$Rainfall,x_lab="Rainfall (Inches)",
y_lim_min=0,y_lim_max=2,Selected="Twe")
#> Warning: NaNs produced
#> Warning: NaNs produced
#> Warning: Algorithm RS has not yet converged
#> Warning: non-list contrasts argument ignored
#> Warning: glm.fit: algorithm did not converge
#> Warning: glm.fit: algorithm did not converge
#> Warning: glm.fit: algorithm did not converge
#> Warning: NaNs produced
#> Warning: NaNs produced
#> Warning: NaNs produced
#> Warning: NaNs produced
#> Warning: NaNs produced
#> Warning: NaNs produced
#> Warning: NaNs produced
#> Warning: NaNs produced
#> Warning: NaNs produced
#> Warning: NaNs produced
#> Warning: NaNs produced
#> Warning: NaNs produced
#> Warning: NaNs produced
#> Warning: NaNs produced
#> Warning: NaNs produced
#> Warning: non-list contrasts argument ignored
#> 1.5 1.7 1.9 2.1 2.3 2.5
#> .....
#> Warning: glm.fit: algorithm did not converge
#> .
#> Warning: glm.fit: algorithm did not converge
#> Done.
#> Warning: glm.fit: algorithm did not converge
#> Warning: non-list contrasts argument ignored
#> 1.5 1.7 1.9 2.1 2.3 2.5
#> .....
#> Warning: glm.fit: algorithm did not converge
#> .
#> Warning: glm.fit: algorithm did not converge
#> Done.
#> Warning: glm.fit: algorithm did not converge