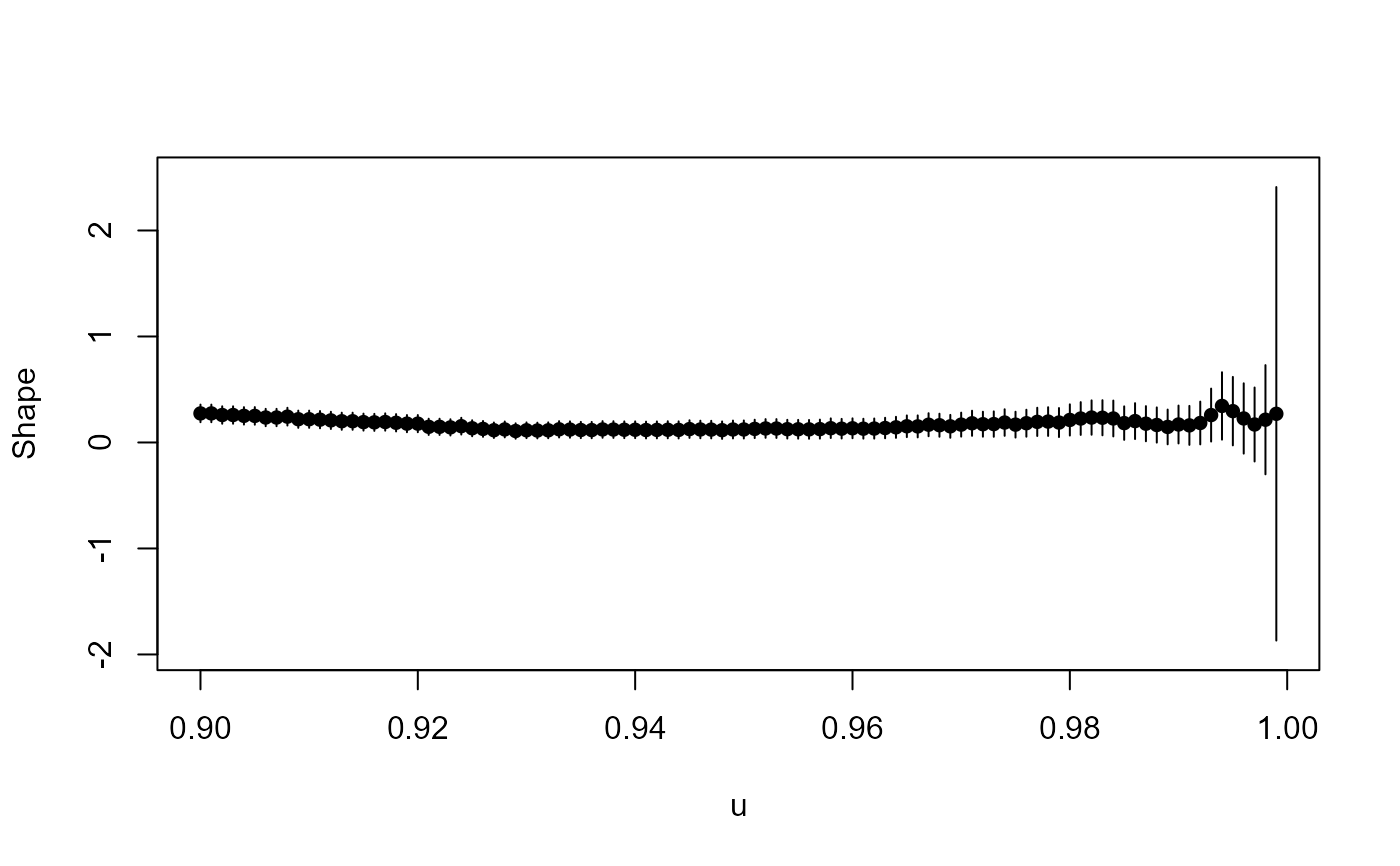
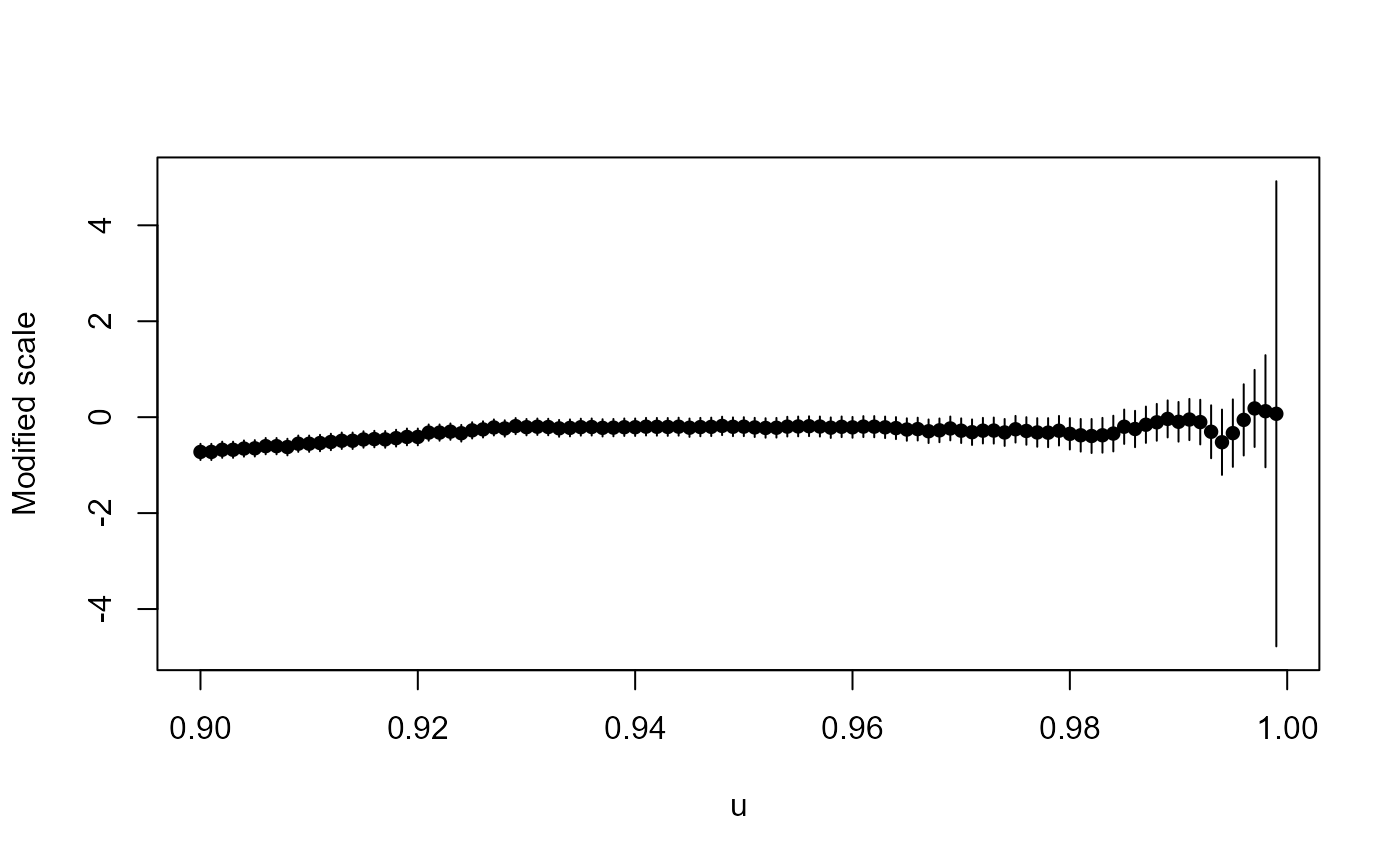
GPD parameter stability plots
GPD_Parameter_Stability_Plot.RdPlots showing the stability of the GPD scale and shape parameter estimates across a specified range of thresholds.
Arguments
- Data
Numeric vector containing the declusted data.
- Data_Full
Numeric vector containing the non-declustered data.
- u
Numeric vector of GPD thresholds; given as a quantiles
[0,1]ofDatavector. Default is0.9to0.999in intervals of0.001.- PLOT
Logical; indicating whether to plot diagnostics. Default is
FALSE.
Value
Plot of the shape and modified scale parameter estimates along with their errors bars over the range of specified thresholds.