The empirical mean excess function is linear in the case of a GPD.
Arguments
- Data
A vector comprising a declustered and if necessary detrended time series to be modelled.
Value
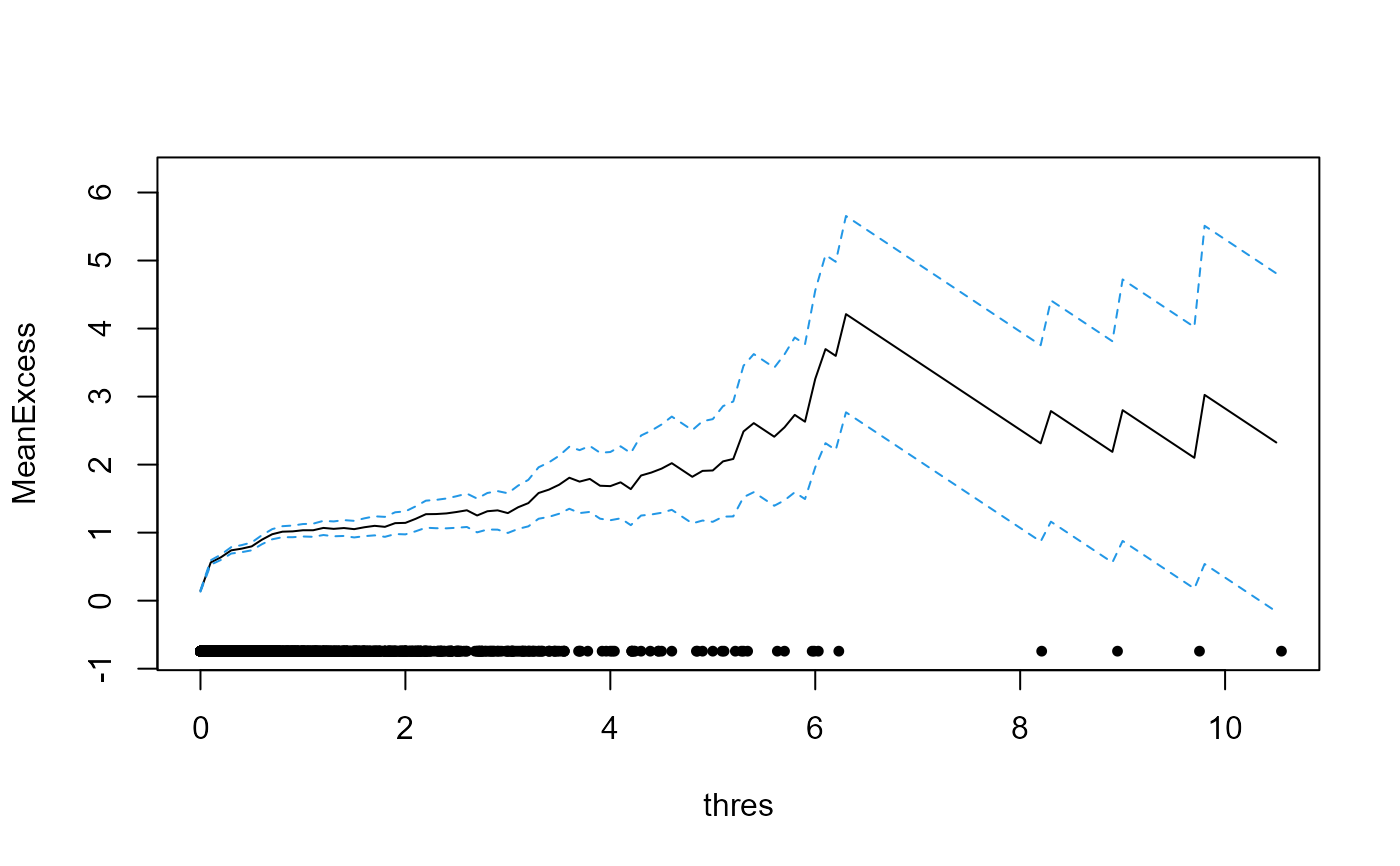
Plot of the empirical mean excess function (black line), average of all observations exceeding a threshold decreased by the threshold, for thresholds spanning the range of the observations. Also provided are 95% confidence intervals (blue dotted lines) and the observations (black dots).
Examples
Mean_Excess_Plot(Data=S20.Detrend.Declustered.df$Rainfall)