Surge identification criterion
Surge_Criterion.RdClassify extreme water levels as either tidally dominated or surge driven.
Usage
Surge_Criterion(
  Data,
  Cluster_Max,
  Criterion_Number = "NA",
  Surge_Thres = 0.25,
  Rainfall_Thres = NA,
  Pre_Sur = 7,
  MaxMin = "Max",
  Rainfall_Interval = NA
)
Arguments
- Data
A data frame with co-occurring rainfall and O-sWL time series in two columns labeled
"Rainfall"and"OsWL", respectively.- Cluster_Max
Numeric vector containing indexes of peaks in the O-sWL column of
Data. If analyzing a sample conditioned on O-sWL derived usingCon_Sample_2D()set equal to the$xconoutput.- Criterion_Number
Numeric vector of length one, specifying which of the five criterion detailed in the report to adopt. If a user-defined criterion is adopted set to
NAwhich is the default.- Surge_Thres
Numeric vector of length one, specifying the minimum elevation difference between a peak and prior maximum or minimum for the peak to be classified as surge driven. Default is
0.25.- Rainfall_Thres
Numeric vector of length one, specifying minimum rainfall within a +/-
Rainfall_Intervalperiod of a peak for the peak to be classified as surge driven. Default isNA.- Pre_Sur
Numeric vector of length one, specifying, minimum length of time allowed between preceding maximum or minimum and the peak. Default is
7.- MaxMin
Character vector of length one, specifying whether elevation difference refers to the preceding minimum (
"Min") or maximum ("Max"). Default is"Max".- Rainfall_Interval
Numeric vector of length one, specifying length of time before and after a peak over which to sum rainfall totals. Total window width is 2*
Rainfall_Interval+1. Default isNA.
Examples
#Decluster O-sWL series at S-13 using a runs method
S13.OsWL.Declust = Decluster(Data=S13.Detrend.df$OsWL,
SepCrit=24*7, u=0.99667)
#Classify peak water levels as either surge or tidally driven
surge_class = Surge_Criterion(Data = S13.Detrend.df,
Cluster_Max = S13.OsWL.Declust$EventsMax,
Criterion_Number = 5)
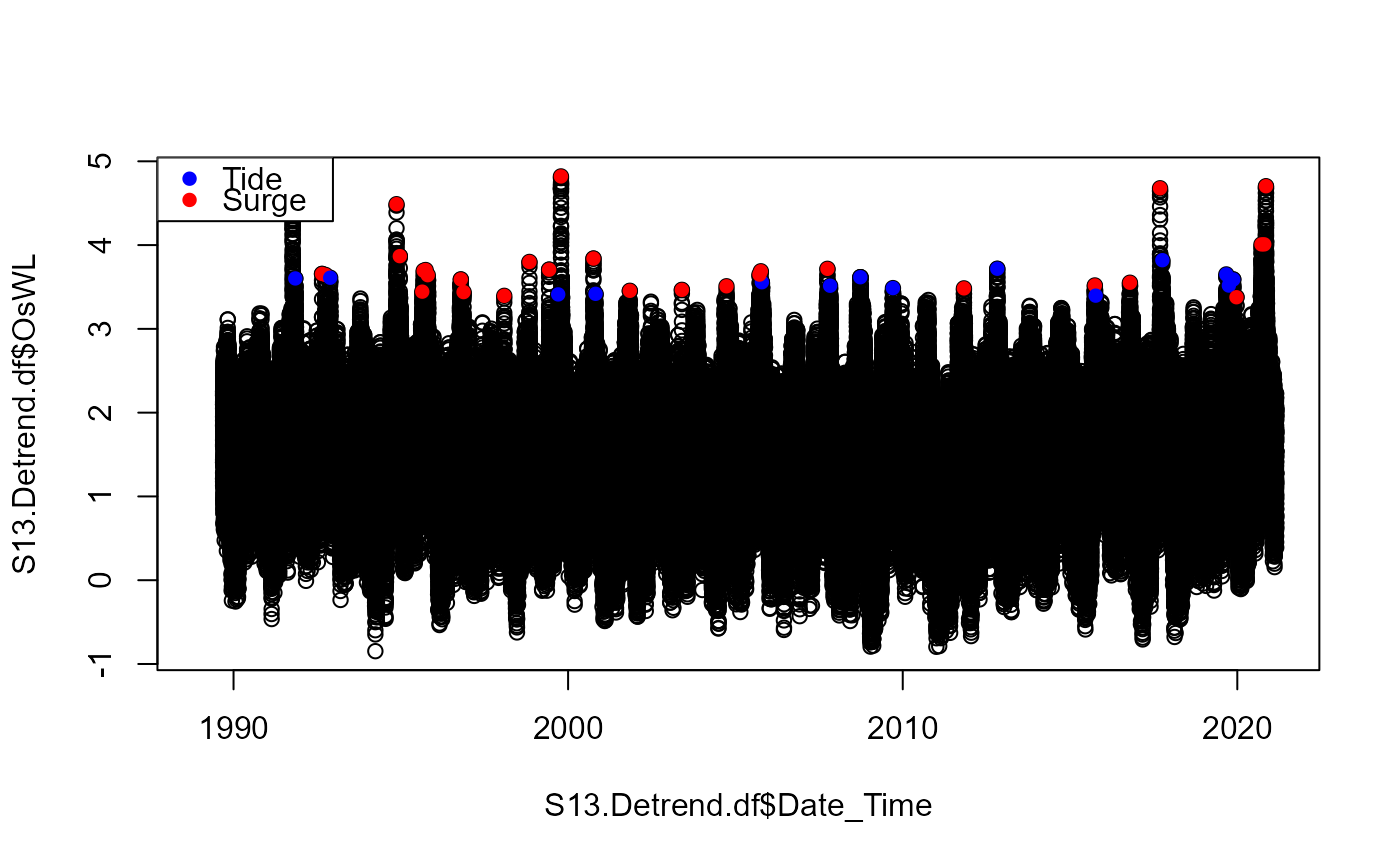
#Plot O-sWL time series with peaks the color of peaks representing classification
S13.Detrend.df$Date_Time = as.POSIXct(S13.Detrend.df$Date_Time)
plot(S13.Detrend.df$Date_Time,S13.Detrend.df$OsWL)
points(S13.Detrend.df$Date_Time[S13.OsWL.Declust$EventsMax],
S13.Detrend.df$OsWL[S13.OsWL.Declust$EventsMax],
col=ifelse(surge_class=="Tide","Blue","Red"),pch=16)
legend("topleft",c("Tide","Surge"),pch=16,col=c("Blue","Red"))
 #Example of a custom surge criterion. Peak is classified as tidal if
#Elevation difference between peak and preceding minimum at least 7 hrs before is less than 0.25.
#Total rainfall from 72 hours before and to 72 hrs after the peak is less than 2 Inches
surge_class = Surge_Criterion(Data = S13.Detrend.df,
Cluster_Max = S13.OsWL.Declust$EventsMax,
Surge_Thres=2.5,Rainfall_Thres=2,Pre_Sur=7,
MaxMin="Min",Rainfall_Interval=72)
#Example of a custom surge criterion. Peak is classified as tidal if
#Elevation difference between peak and preceding minimum at least 7 hrs before is less than 0.25.
#Total rainfall from 72 hours before and to 72 hrs after the peak is less than 2 Inches
surge_class = Surge_Criterion(Data = S13.Detrend.df,
Cluster_Max = S13.OsWL.Declust$EventsMax,
Surge_Thres=2.5,Rainfall_Thres=2,Pre_Sur=7,
MaxMin="Min",Rainfall_Interval=72)