Goodness-of-fit for the GPD
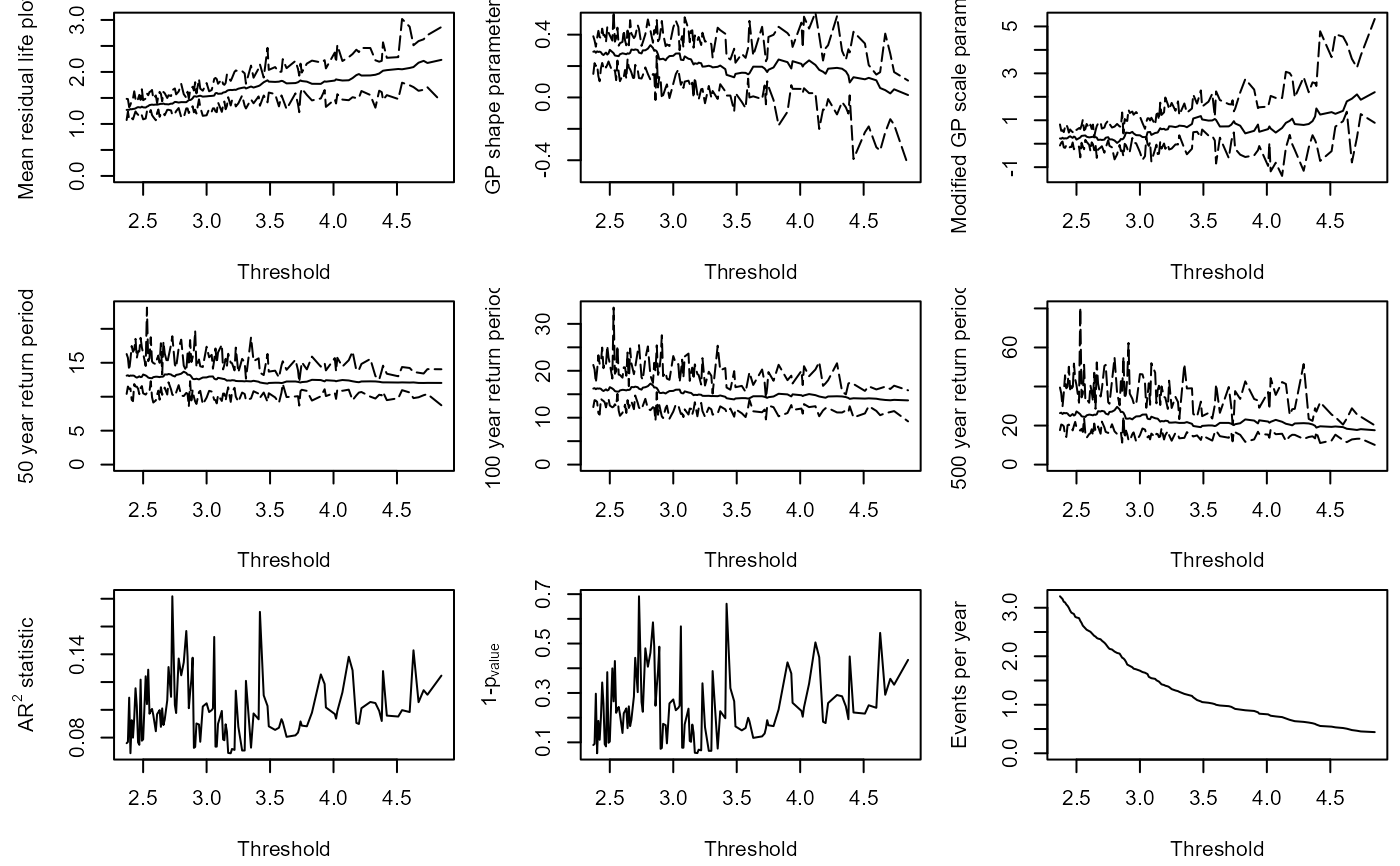
GPD_Threshold_Solari_Sel.RdA nonparametric bootstrapping procedure is undertaken to assess the uncertainty in the GPD parameters and associated return levels for a GPD fit to observations above a user specified threshold. The estimates are compared with those obtained at other thresholds by running the GPD_Threshold_Solari function beforehand, and using its output as an input of this function. The code is based on the AUTOMATICO_MLE_BOOT function provided by Sebastian Solari.
Usage
GPD_Threshold_Solari_Sel(
  Event,
  Data,
  Solari_Output,
  Thres,
  Alpha = 0.1,
  N_Sim = 10^4,
  RP_Min = 1,
  RP_Max = 1000,
  RP_Plot = 100,
  mu = 365.25,
  y_lab = "Data"
)
Arguments
- Event
Numeric vector containing independent events declustered using a moving window approach.
- Data
Original time series. Dataframe containing two columns. In column:
1A"Date"object of equally spaced discrete time steps.2Numeric vector containing corresponding time series values.
- Solari_Output
Output of the
GPD_Threshold_Solarifunction.- Thres
Numeric vector of length one specifying the threshold to analyze, chosen by the user based on plots from the
GPD_Threshold_Solarifunction.- Alpha
Numeric vector of length one specifying the level of confidence associated with the confidence interval i.e., the probability that the interval contains the true value of the parameter is \(1-\frac{Alpha}{2}\). The interval is referred to as the \(100(1-\frac{Alpha}{2})\%\) confidence interval. Default is
0.1.- N_Sim
Numeric vector of length one specifying the number of bootstrap samples. Default is
10^4.- RP_Min
Numeric vector of length one specifying the minimum return level to be calculated. Default is
1.- RP_Max
Numeric vector of length one specifying the maximum return level to be calculated. Default is
1000.- RP_Plot
Numeric vector of length one specifying the return level in the lower right plot. Default is
100.- mu
(average) occurrence frequency of events in the original time series
Data. Numeric vector of length one. Default is365.25, daily data.- y_lab
Character vector specifying the y-axis label of the return level plot.
Value
List containing three objects: Estimate, CI_Upper and CI_Lower. The Estimate dataframe comprises
xiGPD shape parameter estimate for the threshold isThres.sigmaGPD scale parameter estimate for the threshold isThres.ThresGPD location parameter estimate for the threshold isThres.rateGPD rate parameter i.e., number of independent excesses per year for a threshold ofThres.The remaining columns are
RLReturn level estimates from the GPD using a threshold ofThres.
CI_Upper and CI_Lower give the upper and lower bounds of the \(100(1-\frac{Alpha}{2})\%\) confidence interval for the corresponding element in Estimate.
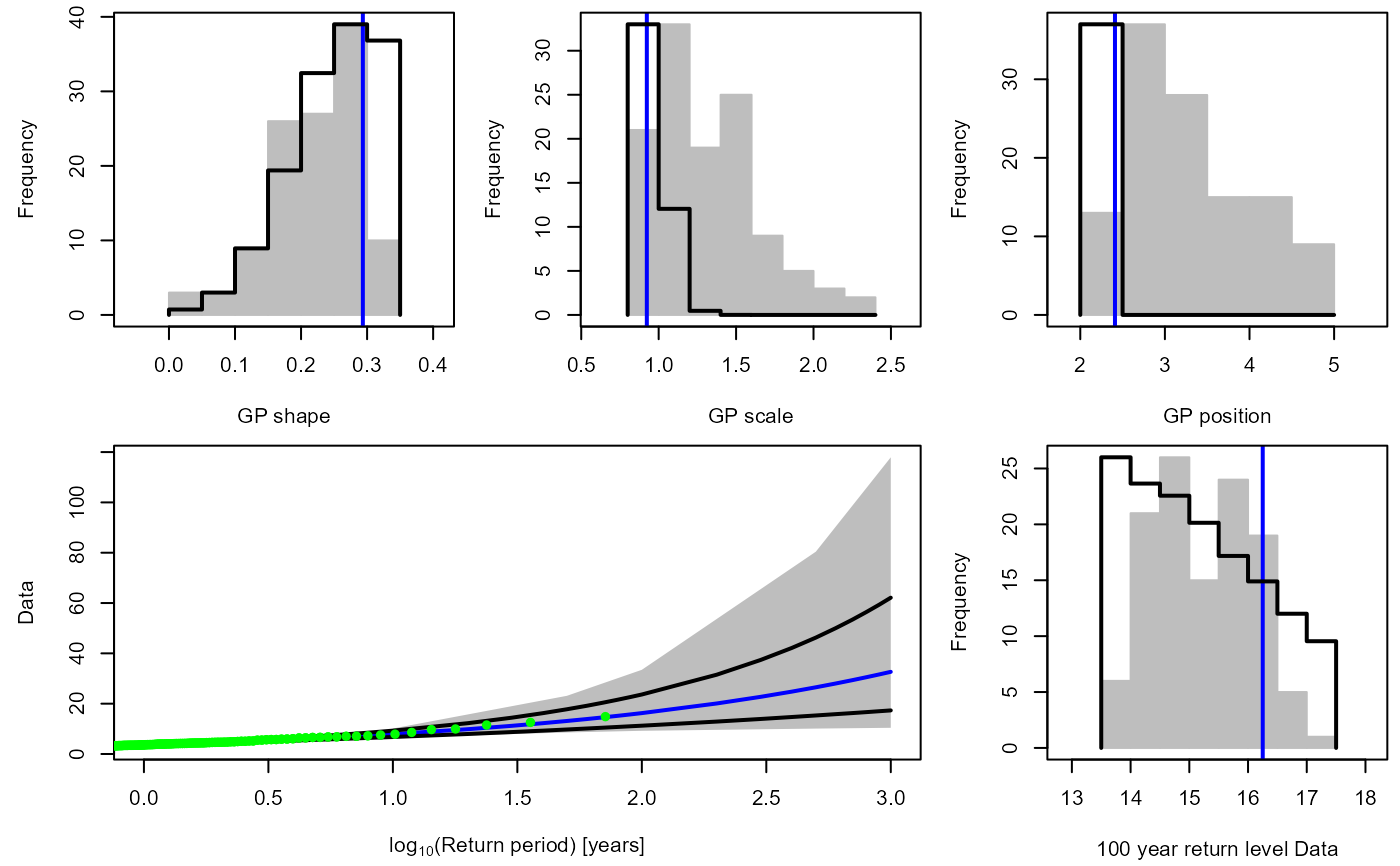
Top row: Histograms of the GPD parameter estimates based on a nonparametric bootstrapping simulation. Grey bars correspond to the estimates obtained as the threshold (Thres) is varied, found by running the function a necessary input of the function. Continuous black lines correspond to results obtained by fixing the threshold at Thres. Dashed blue lines correspond to the expected values for the fixed threshold.
Lower left: Return level plot. Return levels of the observations estimated from the empirical distribution. Grey bars correspond to the maximum of the upper and lower bounds of the \(100(1-\frac{Alpha}{2})\%\) confidence intervals as the threshold is varied. Continuous black lines correspond to results obtained by fixing the threshold at Thres. Dashed blue lines correspond to the expected values for the fixed threshold.
Lower right: As in the top row but for the 100 years return period quantile.
Examples
#Declustering the O-sWL at site S22 using a 3-day window.
Rainfall_Declust_SW<-Decluster_SW(Data=S22.Detrend.df[,c(1:2)],Window_Width=7)
#> Warning: no non-missing arguments to max; returning -Inf
#> Warning: no non-missing arguments to max; returning -Inf
#> Warning: no non-missing arguments to max; returning -Inf
#> Warning: no non-missing arguments to max; returning -Inf
#> Warning: no non-missing arguments to max; returning -Inf
#Finding an appropriate threshold for the declustered series
S22_OsWL_Solari<-GPD_Threshold_Solari(Event=Rainfall_Declust_SW$Declustered,
                                      Data=na.omit(S22.Detrend.df[,2]),
                                      Min_Quantile = 0.99)
#> Fitted values of xi < -0.5

S22_OsWL_Solari_Sel<-GPD_Threshold_Solari_Sel(Event=Rainfall_Declust_SW$Declustered,
                                          Data=S22.Detrend.df[,2],
                                          Solari_Output=S22_OsWL_Solari,
                                          Thres=S22_OsWL_Solari$Candidate_Thres)
S22_OsWL_Solari_Sel<-GPD_Threshold_Solari_Sel(Event=Rainfall_Declust_SW$Declustered,
Data=S22.Detrend.df[,2],
Solari_Output=S22_OsWL_Solari,
Thres=S22_OsWL_Solari$Candidate_Thres)