Intensity
Intensity.RdCalculates the "intensity" of extreme water levels, as defined in Wahl et al. (2011).
Arguments
- Data
A data frame containing the water level time series. First column may be a
"Date"object.- Cluster_Max
Numeric vector containing indexes of the water level peaks in
Data. If analyzing a sample conditioned on water level derived usingCon_Sample_2D()set equal to the$xconoutput.- Base_Line
Vector of length one, specifying water level about which to calculate the intensity. Default is
"Mean"where the mean of the entire time series is used as the baseline water level above which intensity is calculated.
Value
A data frame with the following columns:
Pre.HighIndex of the water level column ofDatacontaining the preceding high water level.Fol.HighIndex of the water level column ofDatacontaining the following high water level.Pre.LowIndex of the water level column ofDatacontaining the preceding low water level.Fol.LowIndex of the water level column ofDatacontaining the following low water level.IntensityIntensity of the extreme water level event.
Examples
#Decluster O-sWL series at S-13 using a runs method
S13.OsWL.Declust = Decluster(Data=S13.Detrend.df$OsWL,
SepCrit=24*7, u=0.99667)
#Calculate O-sWL of the identified cluster maximum
intensity = Intensity(Data=S13.Detrend.df[,c(1,3)],Cluster_Max=S13.OsWL.Declust$EventsMax)
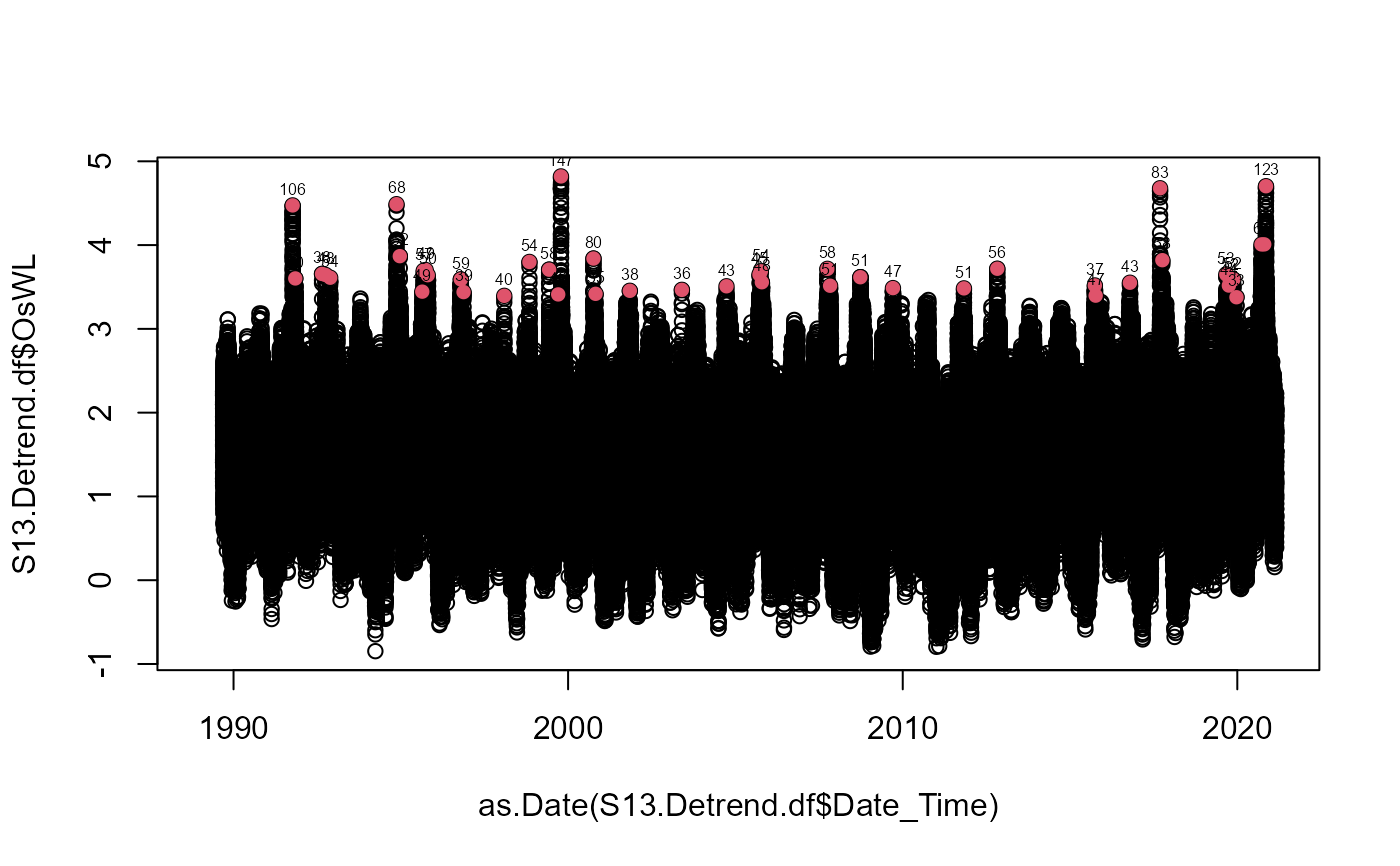
#Plot O-sWL series identifying cluster maximum (in red) and print "intensity" above each maximum
plot(as.Date(S13.Detrend.df$Date_Time),
S13.Detrend.df$OsWL)
points(as.Date(S13.Detrend.df$Date_Time[S13.OsWL.Declust$EventsMax]),
S13.Detrend.df$OsWL[S13.OsWL.Declust$EventsMax],pch=16,col=2)
text(as.Date(S13.Detrend.df$Date_Time[S13.OsWL.Declust$EventsMax]),
S13.Detrend.df$OsWL[S13.OsWL.Declust$EventsMax]+0.2,
round(intensity$Intensity,0),cex=0.5)