Derive water level curves
WL_Curve.RdGenerates water level curves for simulated extreme water levels based on a simulated "intensity".
Usage
WL_Curve(
  Data,
  Cluster_Max,
  Pre_Low,
  Fol_Low,
  Thres,
  Base_Line = mean(Data$OsWL, na.rm = TRUE),
  Limit,
  Peak,
  Intensity,
  Length = 144
)
Arguments
- Data
A data frame of the time series with the column containing ocean-side water levels labeled
"OsWL".- Cluster_Max
Numeric vector containing indexes of peaks in the O-sWL column of
Data. If analyzing a sample conditioned on O-sWL derived usingCon_Sample_2D()set equal to the$x.conoutput.- Pre_Low
Numeric vector of the indexes of the O-sWL column in
Datacontaining the preceding low water level.- Fol_Low
Numeric vector of the indexes of the O-sWL column in
Datacontaining the following low water level.- Thres
Numeric vector of length one, specifying threshold above which to apply the method. Below the threshold an observed curve with an intensity less than
limitis randomly sampled.- Base_Line
Numeric vector of length one, specifying water level about which to calculate the intensity. Default is the mean O-sWL.
- Limit
Numeric vector of length one, specifying an upper limit on the observed water level curve intensities to sample for simulated peaks less than
Thres.- Peak
Numeric vector of simulated peak water levels.
- Intensity
Numeric vector of the intensity associated with each simulated
Peak.- Length
Numeric vector of length one, specifying the length of time over which the water level curve is simulated before (and after) the time of the simulated peak. Total duration of the water level curve is 2*
Length+1. Minimum is5. Default is144.
Value
A data frame, where each row contains the water level curve generated for corresponding simulated peak in the Peak input. A vector of the intensity Intensity of the generated water level curve.
Examples
#Declustering O-sWL series
S13.OsWL.Declust = Decluster(Data=S13.Detrend.df$OsWL,
SepCrit=24*7, u=0.99667)
#Use O-sWL intensity function to obtain index of preceding and following low water levels
intensity = OsWL_Intensity(Data=S13.Detrend.df,Cluster_Max=S13.OsWL.Declust$EventsMax)
#Four synthetic events
sim.peaks = c(3.4,4,4.2,5)
sim.intensity = c(38,48,120,140)
#Generating the water level curves
oswl_ts_oswl = WL_Curve(Data = S13.Detrend.df,
Cluster_Max = S13.OsWL.Declust$EventsMax,
Pre_Low = intensity$Pre.Low,
Fol_Low = intensity$Fol.Low,
Thres = S13.OsWL.Declust$Threshold, Limit = 45,
Peak = sim.peaks,
Intensity = sim.intensity)
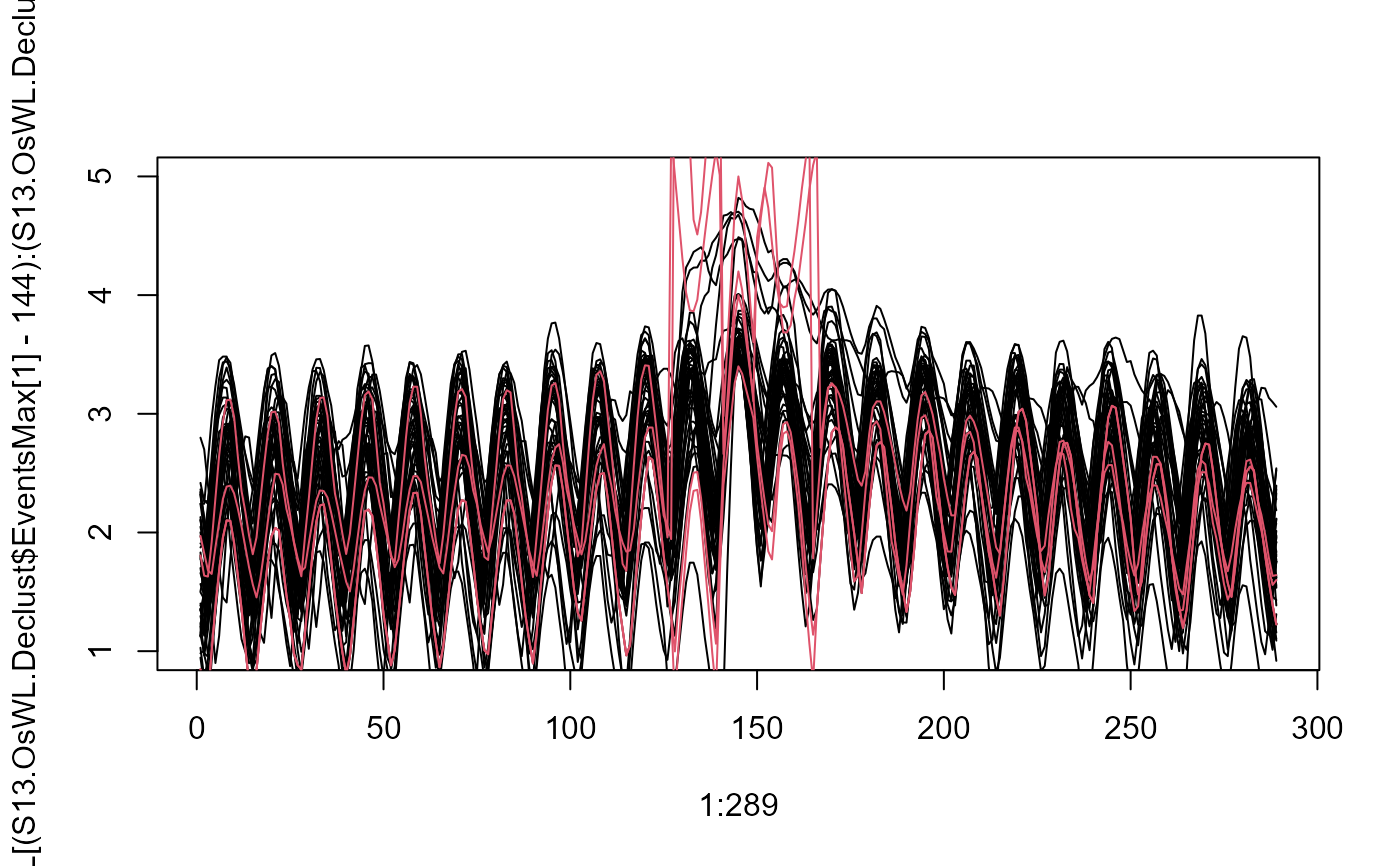
#Plot the water level curves of the observed peaks
plot(1:289,
S13.Detrend.df$OsWL[(S13.OsWL.Declust$EventsMax[1]-144):
(S13.OsWL.Declust$EventsMax[1]+144)],
type='l',ylim=c(1,5))
for(i in 2:length(S13.OsWL.Declust$EventsMax-144)){
lines(1:289,
S13.Detrend.df$OsWL[(S13.OsWL.Declust$EventsMax[i]-144):
(S13.OsWL.Declust$EventsMax[i]+144)])
}
#Superimpose the curves generated for the four synthetic events
for(i in 1:4){
lines(1:289,oswl_ts_oswl$Series[i,],col=2)
}