C and D-vine Copula - Simulation
Vine_Copula_Sim.RdSimulating from specified C- and D-vine copula models. Function is a repackaging of the RVineMatrix and RVineMatrix functions from the VineCopula package into a single function.
Arguments
- Data
Data frame containing
nat least partially concurrent time series. First column may be a"Date"object. Can beDataframe_Combineoutput.- Vine_Model
An
RVineMatrixobject i.e., output ofVine_Copula_Fitspecifying the structure and copula families composing the vine copula.- Marginals
An
migpdobject containing the d-independent generalized Pareto models.- mu
(average) Number of events per year. Numeric vector of length one. Default is 365.25, daily data.
- N
Number of years worth of extremes to be simulated. Numeric vector of length one. Default 10,000 (years).
Value
List comprising an integer vector specifying the pair-copula families composing the C- or D-vine copula Vine_family, its parameters Vine_par and Vine_par2 and type of regular vine Vine_Type. In addition, data frames of the simulated observations: u.Sim on the transformed $[0,1]^n$ and x.Sim the original scales.
Examples
#Fitting GPD to independent cluster maxima
S20.Migpd<-Migpd_Fit(Data=S20.Detrend.Declustered.df,
Data_Full=S20.Detrend.df,
mqu=c(0.975,0.975,0.9676))
#Fitting vine copula
S20.Vine<-Vine_Copula_Fit(Data=S20.Detrend.df)
#Simulating from fitted copula
S20.Vine.Sim<-Vine_Copula_Sim(Data=S20.Detrend.df,Vine_Model=S20.Vine,
Marginals=S20.Migpd,N=10)
#> Warning: longer object length is not a multiple of shorter object length
#> Warning: longer object length is not a multiple of shorter object length
#> Warning: longer object length is not a multiple of shorter object length
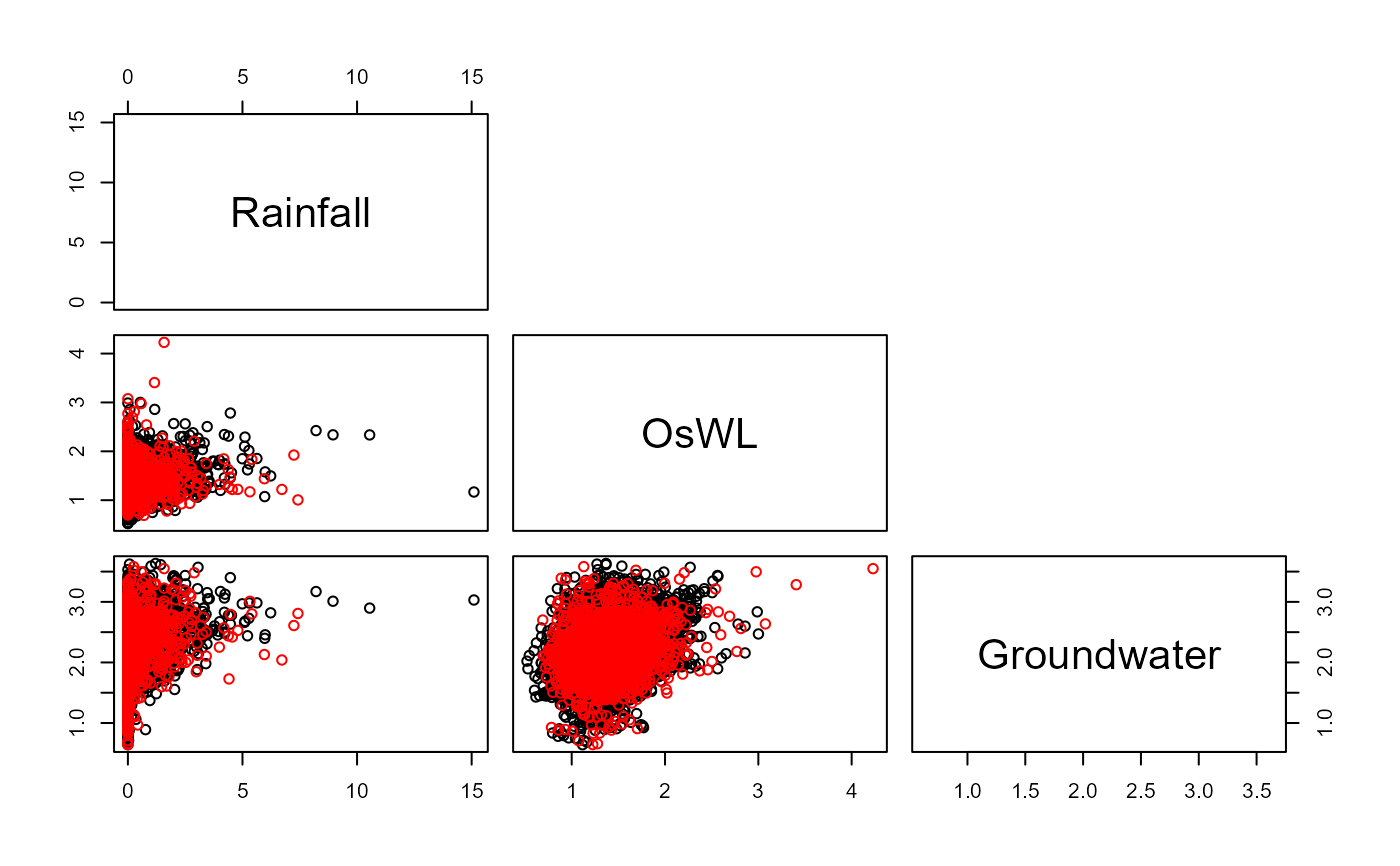
#Plotting observed (black) and simulated (red) values
S20.Pairs.Plot.Data<-data.frame(rbind(na.omit(S20.Detrend.df[,-1]),S20.Vine.Sim$x.Sim),
c(rep("Observation",nrow(na.omit(S20.Detrend.df))),
rep("Simulation",nrow(S20.Vine.Sim$x.Sim))))
colnames(S20.Pairs.Plot.Data)<-c(names(S20.Detrend.df)[-1],"Type")
pairs(S20.Pairs.Plot.Data[,1:3],
col=ifelse(S20.Pairs.Plot.Data$Type=="Observation","Black","Red"),
upper.panel=NULL)